Analytics & Reports

Decisions Backed by Live Institutional Data

Enrollment trends, examination performance, fee collection, attendance patterns — every metric across your institution in real-time dashboards and one-click reports.
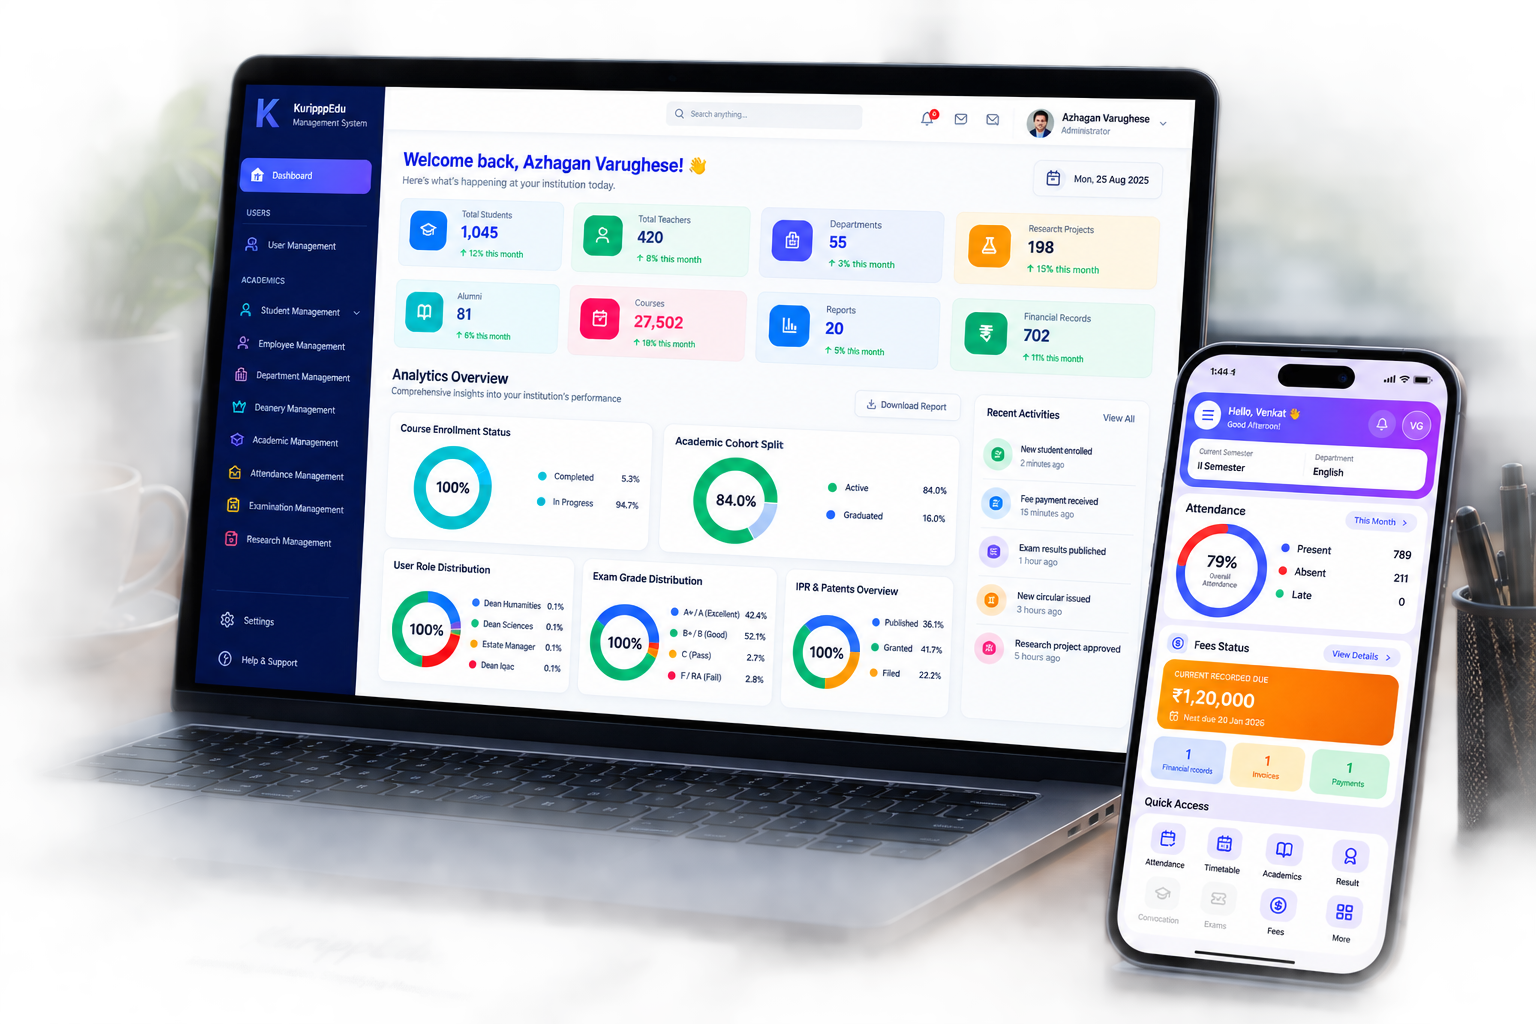
Real-Time Dashboards Custom Report Builder PDF • Excel • CSV Drill-Down Analysis
78% Enrollment 4,218 ▲ Pass Rate 91.2% Attendance 86% Collection 96%
Institution-Wide Intelligence

Every Department, Every Metric

01Executive Dashboards
02Enrollment & Admission Trends
03Attendance Analytics
04Examination Performance
05Fee Collection Analysis
06Faculty Workload & Performance
07Department Comparisons
08Custom Report Builder
09Scheduled Email Reports
10PDF, Excel & CSV Exports
Intelligent Features

From Raw Data to Confident Decisions

Role-Based Dashboards

The Right View for Every Decision Maker

Principals see institution health. HODs see department performance. Coordinators see their programmes. Everyone gets a live dashboard scoped to their role.

  • Executive overview for management & trustees
  • Department and programme-level drill-downs
  • Live KPIs — no waiting for monthly compilations
  • Multi-campus consolidation for groups
Institution Engineering Science Arts CSE — Pass rate 94.6% Attendance 89% CO Attainment Level 2.8
Custom Report Builder

Any Report, Built Without IT Tickets

Drag in the fields you need, apply filters, and save the report — it's ready to re-run every semester or delivered to your inbox on schedule.

  • Drag-and-drop fields from any module
  • Filters by year, programme, department or batch
  • Saved templates and scheduled email delivery
  • University submission & accreditation formats built in
Student Name Attendance % Semester GPA Fee Status PDF Excel
Early-Warning Insights

Spot Problems While They're Still Small

Attendance dipping in one class? Collection lagging in one programme? Trend detection surfaces anomalies before they become end-of-semester surprises.

  • At-risk student identification from attendance & marks
  • Department performance trends year over year
  • Configurable threshold alerts for key metrics
Attendance dip detected CSE-B • Week 8 • −12% vs avg
Reports Library

Institution-Ready Reports in One Click

Every report your office produces manually today, generated in seconds — in the formats universities, auditors and accreditation bodies expect.

Result AnalysisPass/fail • toppers
AttendanceDaily • monthly • shortage
Fee CollectionDaily • defaulters
CO-PO AttainmentAccreditation ready
University FormatsSubmission ready
Custom ReportsSaved templates
Key Benefits

Replace Weeks of Compilation with Real-Time Answers

Instant, Not Monthly

Live dashboards replace end-of-month compilation cycles entirely.

Drill Into Anything

Go from institution overview to a single student's record in three clicks.

Problems Surface Early

Threshold alerts flag at-risk students and lagging metrics automatically.

Every Format Covered

PDF, Excel, CSV — plus university and accreditation submission formats.

Ready to Transform Your Institution?

Designed to help educational institutions embrace digital transformation with confidence.